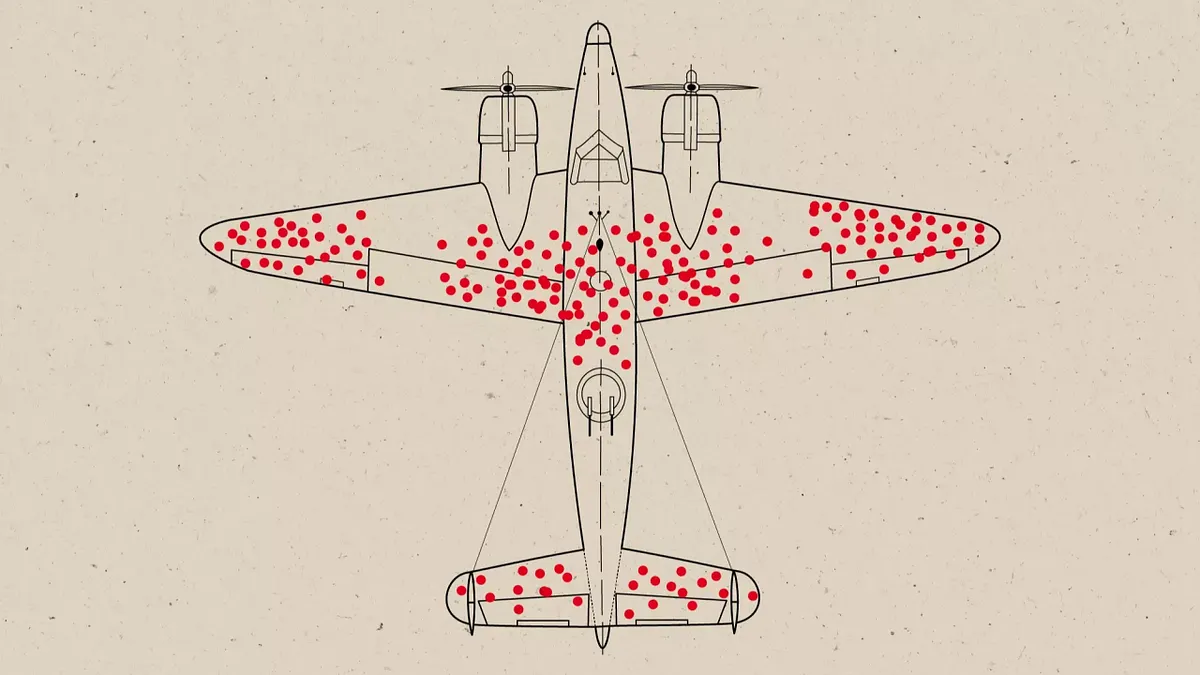

During World War II, the Allied military was struggling with a problem: their bombers were returning from raids riddled with bullet holes. Naturally, they wanted to armor the planes to make them safer. They sat down with the data, looked at the damage patterns, and noted one important finding: there were far more bullet holes in the wings and the fuselage than anywhere else.
Their initial instinct was to add extra armor where the damage was concentrated. But Abraham Wald, a mathematician with Columbia University’s Statistical Research Group, pointed out what the data couldn’t show.
The data only included the planes that made it back. The planes that were hit in the engines, the cockpit, or the tail section weren’t in the hangar to be inspected, because those were the ones that were shot down and never made it back. The blank spots on the diagram weren't actually safe areas. They were the fatal zones.
This is the classic definition of survivorship bias: focusing on the people or things that "survived" some process, while inadvertently overlooking those that didn't due to lack of visibility.
I am a self-proclaimed history buff, but I’m not raising this for the history lesson. The point is that the same trap is built into the way most companies observe their mobile apps.
The Limitations of Traditional Observability
Traditional observability tools were built around a server-side model: collect on the device, ship it to a central backend, and analyze it there. As a result, the dashboards you’re looking at, and the data your AI agents have access to, rely by definition on the information that was able to make it back to your servers.
Think about how traditional mobile observability works. Most tools are good at catching crashes: the report is saved on the device and sent the next time the user opens the app. But the session data that explains them is sampled, often down to just 1 to 2% of sessions. And the problem becomes even more opaque when the issue isn’t simply a crash - it can be a slow response, bugs or a multitude of other issues. So if you get a report at all, it arrives with little of the context around it, and only if that user comes back at all. Everything else, including logs, network timings and performance data, has to make it off the device, often over a spotty connection, before anyone can see it.
Why Sample to Begin With?
Teams sample because the economics demand it. Traditional tools charge to ingest and store data, and a mobile fleet generates an enormous amount of it across millions of devices.
Sampling is how teams keep the bill under control. It’s a rational choice under that model, but it means your observability is dictated by cost, not curiosity. Sampling tilts the picture toward the users who were fine, filtering out the outliers and edge cases that hold the most valuable information.
You cannot fix a problem you cannot see.
The Even Bigger Problem
Most of your worst customer experiences aren’t crashes at all. They’re a screen that takes far too long to load on an older phone, a login that fails and retries behind the scenes, or a checkout that stalls on a weak connection until the customer gives up. No error is thrown, nothing marks those sessions as important, and they’re the first to be sampled away or lost when the app is backgrounded, the connection drops or the battery dies.
Your metrics can’t paint an accurate picture of what actually went wrong or who was affected. So your team spends engineering cycles armoring the wings, optimizing for users who are already having a decent experience, while the issues that drive customers away stay invisible to your observability tools.
A Different Approach
When we founded bitdrift, we knew based on our experience at Twitter and Lyft that to truly understand the health of a mobile app at scale, you have to capture the data where it’s happening on the device itself (i.e. at the edge).
Because bitdrift keeps full-fidelity data on every device, it doesn’t depend on the right session happening to be in the sample. When something goes wrong, whether it’s a crash, a slow screen or a session that quietly stalls, teams can pull back exactly the data they need from exactly the affected devices, including the minutes leading up to it. And because data is stored on the device until it’s needed, there’s no need to sample it away to keep costs in check.
When you use bitdrift, you aren't just looking at the planes that made it back to the hangar. You’re finally getting the full report: the bullet holes, the missing parts, and the critical vulnerabilities.
Why This Matters Even More in the Age of AI
With the industry increasingly handing its observability data to AI agents for troubleshooting, alerting, and even issue resolution, the situation is coming to a head.
Don’t get me wrong. I’m genuinely optimistic about AI agents in mobile reliability, and I’m seeing firsthand the impact they can have on engineering teams’ productivity. Finding a problem nobody predicted means searching across messy, mixed evidence: crashes, network timing, device state, the path a user took through the app. A model can hold more of that at once than any engineer, and it doesn’t need someone to have asked the right question in advance.
But an agent doesn’t know which planes didn’t come back. Point it at sampled telemetry skewed toward the users who were fine, and it will produce a clear, confident analysis of the wrong population. It will find real patterns among healthy sessions and stay blind in exactly the place the answer lives. And its conclusions will sound more authoritative than a human analyst’s hedged guess.
For technology leaders investing in AI across engineering and operations, that’s the risk to manage. The model is rarely the limiting factor; the completeness of the data it reasons over is. An AI strategy built on a biased data pipeline scales that bias, and makes it sound certain.
Look Where the Holes Aren’t
Fixing survivorship bias in observability starts with recognition. Ask your team a few simple questions:
- What share of user sessions do we actually see?
- Would we know if a session got slow or stuck, but didn’t end in a crash?
- If we suspected a problem on one device model in one region, how long would it be until we had data from those exact users? Could we get that data in hours, or would it wait for the next release cycle?
- When our AI tools analyze an incident, are they looking at the whole fleet that’s running our app or only the sample that made it home?
If the answers are uncomfortable, you’re dealing with survivorship bias.
Wald’s insight was recognizing that the missing planes were the most important data in the problem. Leaders who apply the same thinking to mobile will make engineering, product and AI decisions based on all of their customers’ experiences, including the ones who never made it back to report what went wrong.